| Reading the clouds |
| Written by HeHe | |
| Friday, 22 February 2008 | |
|
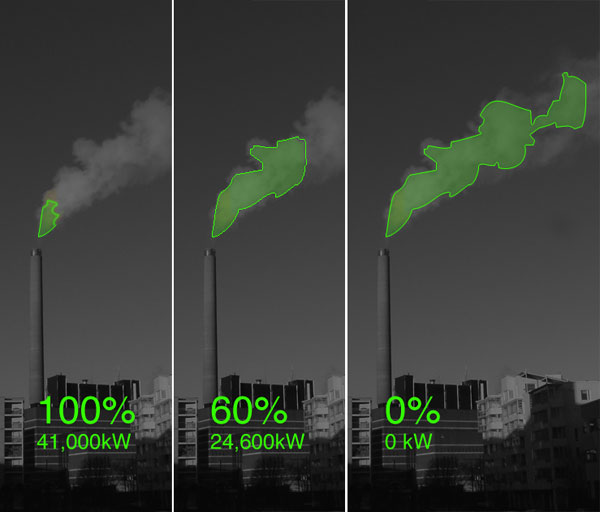
This image shows how to read local energy consumption on the cloud during the week. The kW values shows the actual level on consumption in Ruoholahti & Lauttasaari. The percentage value shows the percentage of 41,000kW, which is the estimated peak consumption for the last week of February 2008. Will it be possible to reach 0 consumption?
Today, on the launch of Nuage Vert, the summer has arrived early in Helsinki. There is no cloud! Please bear with us while we adapt to climate change.
|
|
| Last Updated ( Monday, 25 February 2008 ) |
| < Prev | Next > |
|---|


